Library West’s Data Visualization Wall Opens Students to a Realm of Display Possibilities
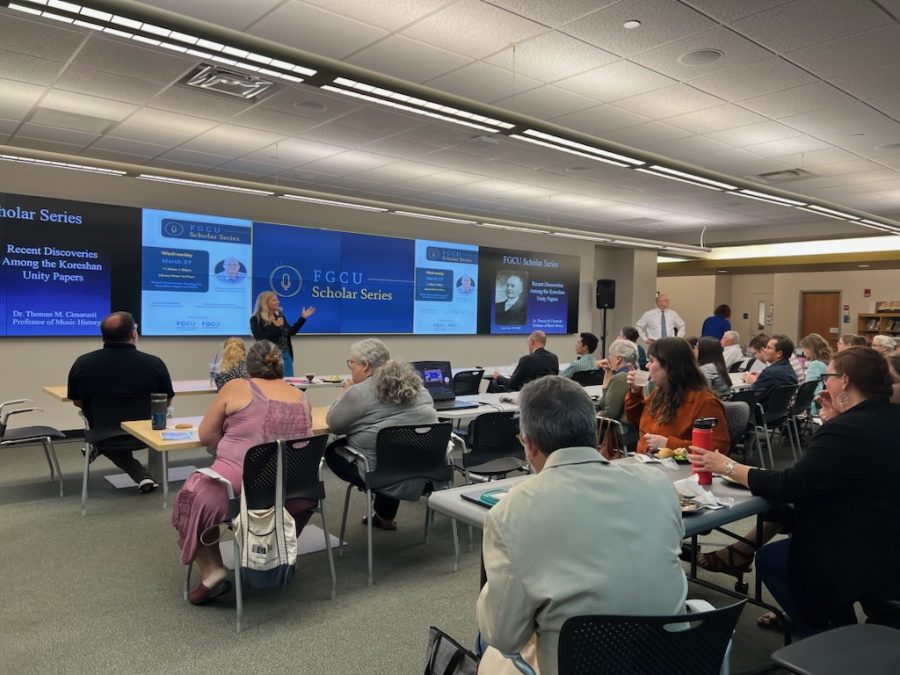
The first official event utilizing the data visualization wall was on March 29 for a discussion held by Thomas Cimarusti, Ph.D. as part of the FGCU Scholar Series. Cimarusti is a professor and program coordinator within the Bower School of Music & the Arts and talked about the recent discoveries among the Koreshan papers at FGCU.
March 30, 2023
The data visualization wall is opened and ready to display its full capabilities to the FGCU community. It’s an opportunity for students and professors on campus to conduct research, study and collaborate in ways never done before at FGCU.
The data visualization wall is in Library West’s first floor, right next to Starbucks. The wall is 32 feet by 5 feet. There are 16 screens total, having two rows of 8 screens. There are four sharing stations and each sharing station consists of four screens. One sharing station can be used at a time but if needed, all four sharing stations can be used at once.
The wall will be the centerpiece of the library’s future operations. The data visualization wall can display infographics to aid with research, displaying in 2D and 3D.
On a day-to-day basis, students will be able to check out a small section of the wall for studying. On a larger scale, the wall will be used for presentations at the library. The data visualization was set to be available this fall; however, operations went ahead of schedule and the wall is now open for students to use.
The process to get the wall established began last February. Matt Losey was promoted from the circulation desk to the creative commons lab coordinator at FGCU. He visited Georgia State University, which had its own data visualization wall. His research at GSU informed the work done at FGCU. He believes in the positives this will bring to students who attend FGCU.
“This will mainly focus on having a space where students can realize their data in a more interactive way,” Losey said.
With one computer screen, the user is constrained to how many pages can be seen. With the data visualization wall, there are more options to view the information. He believes it will amplify the work the faculty and students do year-round.
While it may seem like just a set of screens, it includes advanced and complex technology. The data visualization wall can overlay an image and then lower the opacity. That technology will be used when displaying weather patterns on a map.
There is room for customization as well. You can put a YouTube video on one screen while splitting another screen with two documents. A third screen can have a PowerPoint, while the last contains a Twitter feed. There are up to 20 sources per screen, so the combinations of things to do are seemingly endless.
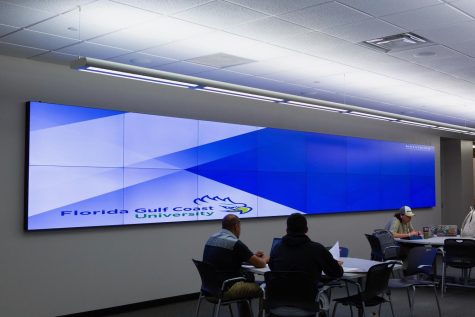
The data visualization wall development totaled $300,000 to create, including the full scope of labor.
Few students are aware of the data visualization wall; however, when students are informed about the benefits of the data visualization wall, they are excited.
Giovanni Marro is a freshman who knew nothing about the data visualization wall. When given a rundown on everything it was about, he was excited about the prospect of using the wall in the future.
“It seems really helpful if you want to visualize and share if you’re doing a group project,” Marro said.
Before the use of this technology, students must go through orientation with Losey to learn how to use the wall. Students are able to then reserve the space a week in advance for up to two hours.
To sign up for the wall, visit the library’s website.


